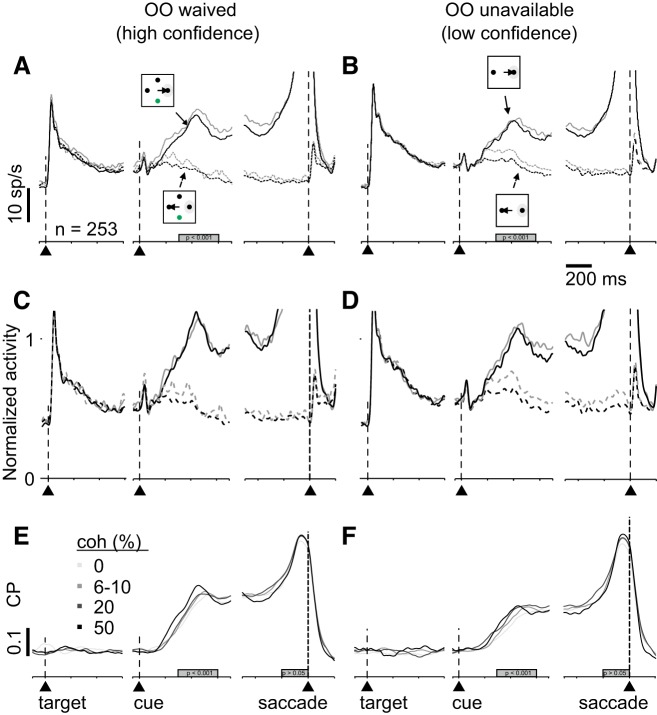
Fig. 5.
Choice probability (CP) analysis reveals confidence signals in superior colliculus (SC). spike density functions (SDFs), and CP in opt-out (OO)-waived (A, C, and E) and OO-unavailable (B, D, and F) trials. A: SDFs (σ = 10 ms) from 253 single and multiple neurons in SC plotted over time for high coherence (black lines: 10 and 20% for monkey P and 20 and 50% for monkey H) and low coherence (gray lines: 0 and 6% for monkey P and 0 and 10% for monkey H). Solid lines show trials in which monkeys chose the target in the response field (RF) and dashed lines show the SDFs from trials in which monkeys chose the opposite target in trials when the OO was available. The alignment is the same as in Fig. 3. B: same as in A for the OO-unavailable trials. C and D: normalized SDF (σ = 10 ms) of the same neurons shown in A and B. The activity was normalized to a 300-ms time window starting 300 ms after the random moving dots appeared. E: CP as a function of time sorted by each coherence in OO-waived trials. Grayscale indicates the different coherencies. Alignment is indicated by the vertical dashed lines and arrowheads. The gray rectangle indicates the time period of quantification. F: same as in E for OO-unavailable trials. The distributions of area under the curve during a time window (gray bard in E and F) are significantly different in the cue period (P < 0.001) but not in the saccade period (P > 0.05).

