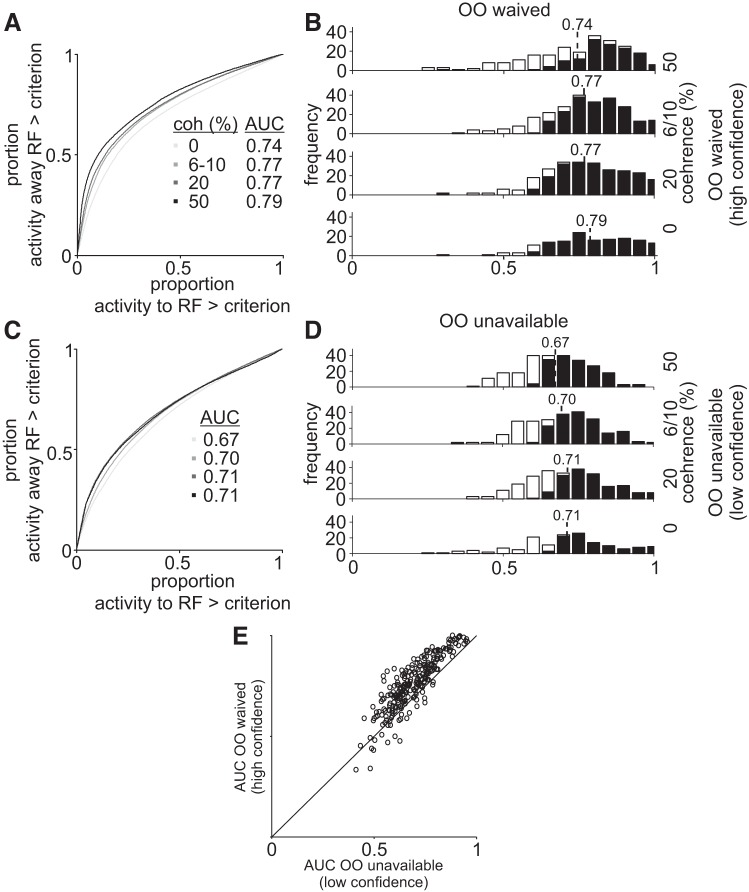
Fig. 6.
A: choice probability predicts the difficulty level in the Stimulus-Matched task. receiver operating characteristic curves plotted for different motion coherences in opt-out (OO)-waived trials in the Stimulus-Matched experiment. The probability of neuronal activity for choices toward the response field (RF) greater than criterion plotted against the probability of neuronal activity choices away from the RF greater than criterion for all motion coherences indicated by the gray scale. Lines falling along the 0.5 indicate no difference in neuronal activity for correct and incorrect choices to the RF. Values greater than 0.5 indicate higher discriminability. B: frequency distribution of the area under the curve (AUC) for each coherence (0, 6, 10, 20, and 50%) for OO-waived trials. The black bars show the number of neurons with an AUC that differs significantly from 0.50 (permutation test, P < 0.05 or P > 0.95). Open bars show the numbers of neurons with AUC that did not differ significantly from 0.50 using the permutation test. C: same as in A for the OO-unavailable trials. D: same as in B for OO-unavailable trials. E: scatter plot of the AUCs of each recording site in OO-unavailable trials (abscissa) and OO-waived trials (ordinate).

