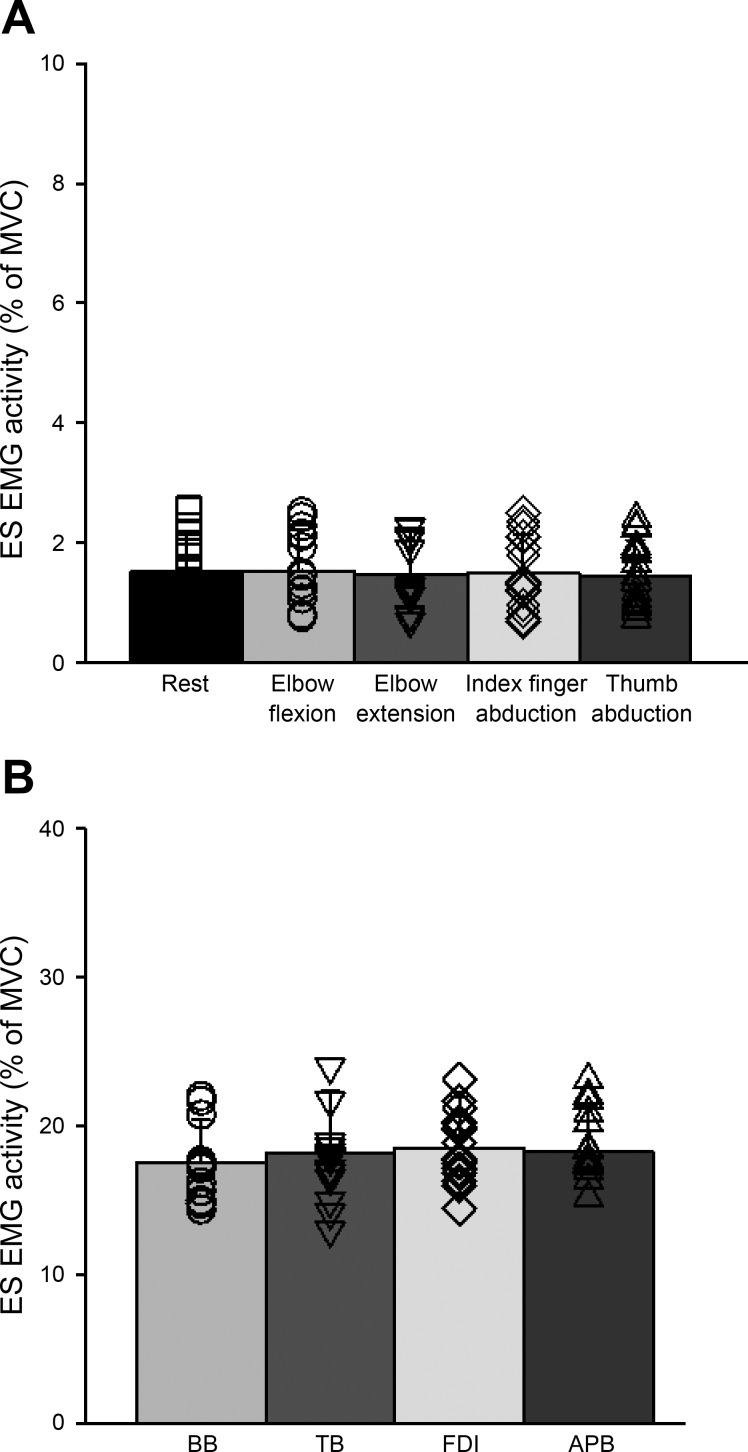
Fig. 2.
Electromyography (EMG). A: group data showing background EMG in erector spinae (ES) across voluntary contractions (n = 16). Testing was completed with the trunk resting on a chair (conditioned referred here as “rest”) and when subjects performed index finger abduction, thumb abduction, elbow flexion, and elbow extension in a pseudorandomized order. The abscissa shows the condition tested (rest, elbow flexion, elbow extension, index finger abduction, and thumb abduction), and the ordinate shows the mean background EMG activity in the ES muscle [as a %maximal voluntary contraction (MVC)]. B: group data showing the background EMG in each muscle tested during 20% of MVC (n = 16). The abscissa shows the muscle tested [biceps brachii (BB), triceps brachii (TB), first dorsal interosseous (FDI), and abductor pollicis brevis (APB)] and the ordinate shows the contraction level (as a % of MVC). Note that individual data are shown for each condition. Error bars indicate the SD. *P < 0.05.

