
Figure 5.
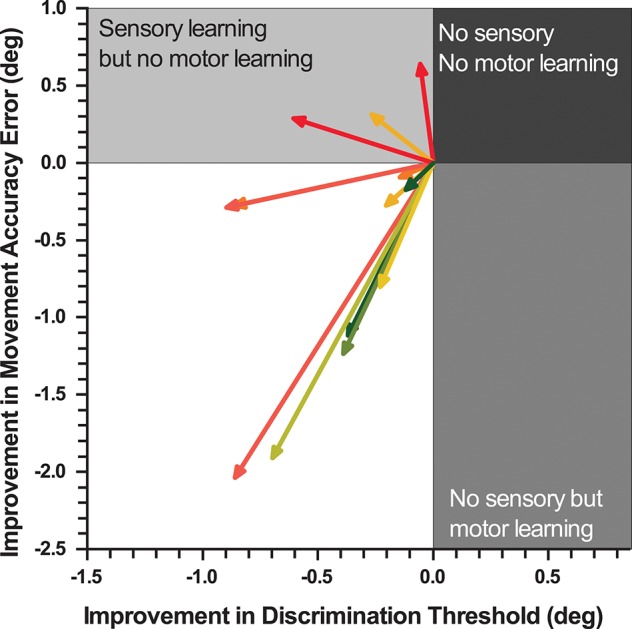
Vectorgram mapping gains in proprioceptive acuity against gains in movement accuracy. Each vector depicts a participant's sensorimotor gain. The coordinates of proprioceptive discrimination threshold and movement accuracy error score are aligned to the origin. The length of the vector indicates the magnitude of relative change and the angle the direction of change.