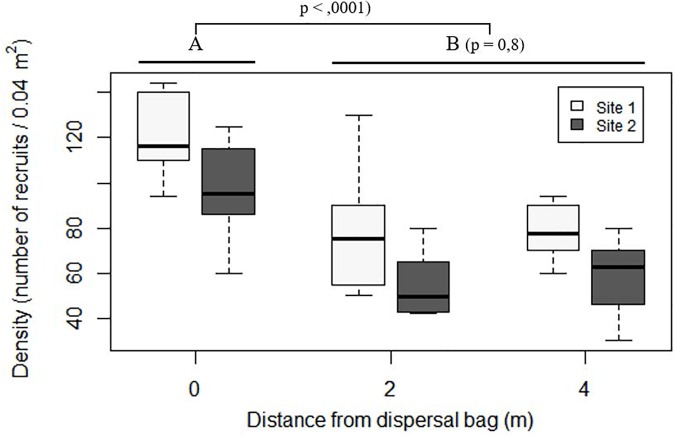
FIGURE 7.
Boxplot of number of recruits on the stones placed in situ at increasing distances from the dispersal bags 5 months after their deployment. In the boxplot, the bold horizontal line indicates the median value (Q2); the box marks the interquartile distances, Q1 and Q3; and the whiskers mark the values that less than Q3+1.5∗IQR but greater than Q1–1.5∗IQR.

