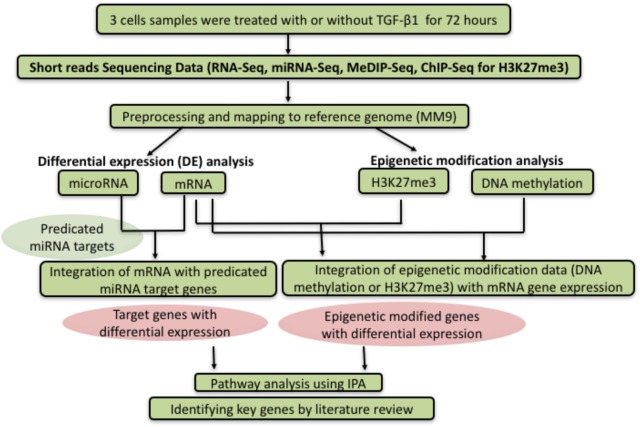
FIGURE 1.
Flowchart of analytic methods. After sequencing the expression level of miRNA, RNA, DNA methylation, and H3K27me3 between control and TGF-β1 treated samples, the datasets were analyzed to investigate the correlation between different genetic or epigenetic level, following by analysis and interpretation through the pathway analysis or literature review.

