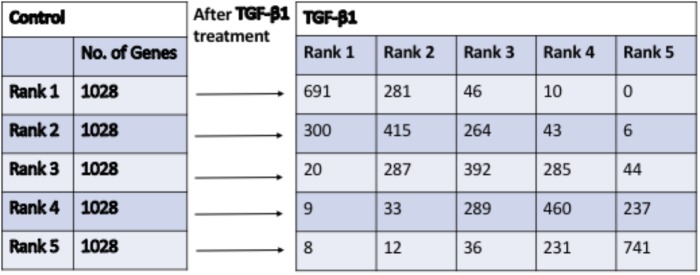
FIGURE 2.
The quintile distribution of DE-genes changes after treatment with TGF-β1, in comparison to control. The genes expression levels were divided equally into 5 ranks from 1 to 5 (from low to high) in Control and TGF-β1 groups. The genes from ranks (1–5) in Control group moved into different ranks (1–5) in TGF-β1 group.

