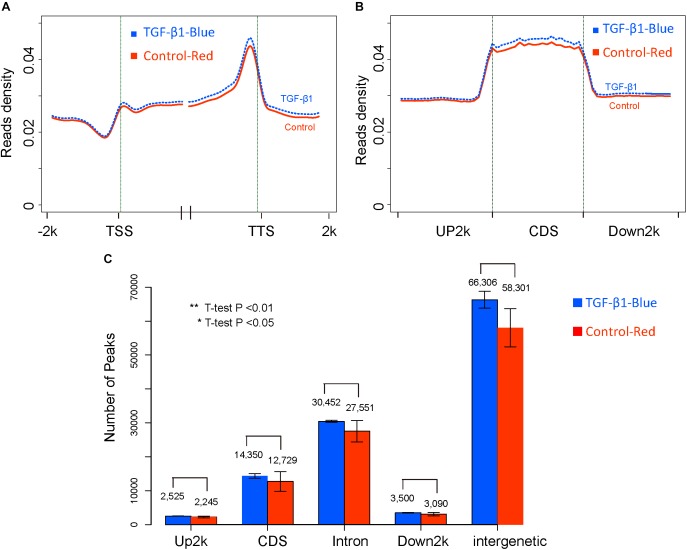
FIGURE 3.
The global DNA methylation level between control and TGF-β1 samples. (A) The reads density in transcription start sites (TTS) and transcription termination sites (TTS). (B) The reads density across gene elements, including up2k, down2k and Coding DNA Sequencing (CDS). (C) The distribution of peaks through different gene elements.

