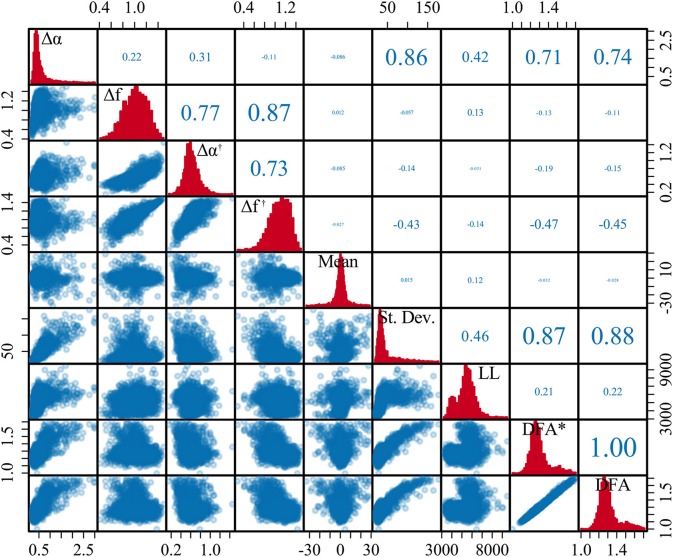
Figure 5.
Correlation between multifractal spectrum and conventional EEG measures for human icEEG data (from Figure 4). The diagonal of the matrix shows the distribution for each measure across epochs. The lower triangle contains the scatter plots for each pair of measures across epochs. The upper triangle shows the Pearson correlation value for each pair of measure, where the size of the font additionally corresponds to the correlation coefficient to provide an additional visual cue.

