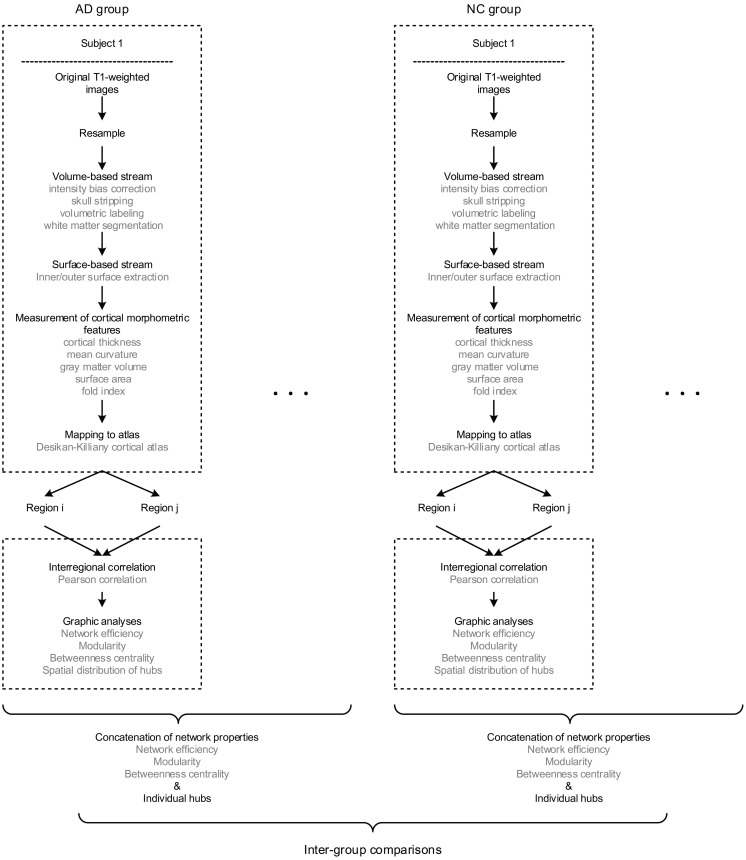
FIGURE 1.
The flow diagram illustrates the pipeline of all the steps involved in the present study. Briefly, for each subject, the raw T1 images were firstly resampled, then processed through volume and surface-based stream in FreeSurfer, and finally obtained regional morphometric feature measurements. Hence, each region was represented as a feature vector. Next, the morphological brain network was built by performing the Pearson correlation across regions. Therefore, every individual has a set of graphic properties, and the inter-group comparisons were conducted by investigating the distinctions of those properties as an intra-group concatenation.

