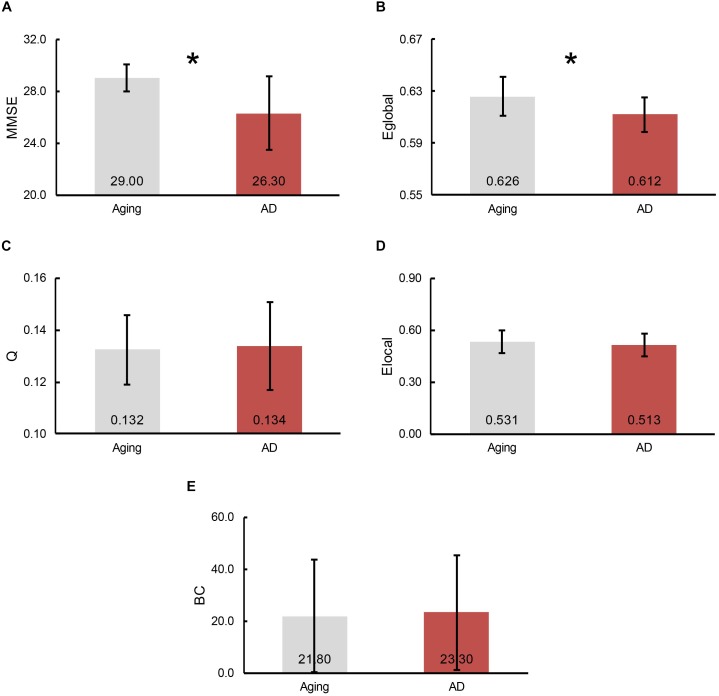
FIGURE 3.
The bars represent the average level of (A) MMSE scores, (B) global efficiency, (C) modularity, (D) local efficiency and (E) betweenness centrality (BC), separately. The error bar indicates the intra-group deviation. Gray denotes the normal control participants, while red marks the AD patients. The significant differences between cohorts were found in Eglobal and MMSE scores, which indicated by an asterisk.

