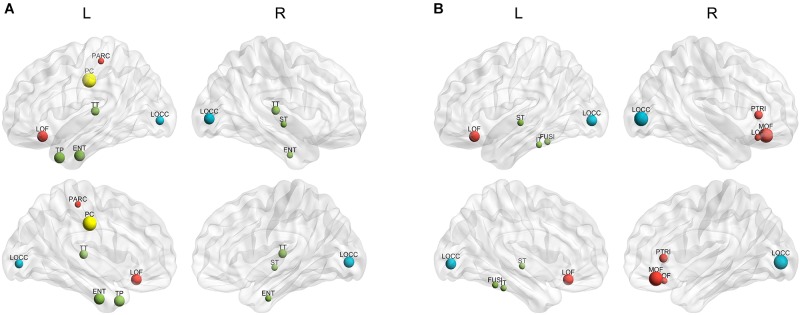
FIGURE 5.
The spatial distributions of hubs for the (A) control and (B) AD group. Colors of the dot are defined based on the different lobes: red denotes the frontal lobe, green denotes the temporal lobe, blue denotes the occipital lobe, and yellow denotes the cingulate cortex. ENT-entorhinal cortex, FUSI-fusiform gyrus, IT-inferior temporal gyrus, LOCC-lateral occipital gyrus, LOF-lateral orbitofrontal gyrus, MOF-medial orbitofrontal gyrus, PARC-paracentral lobule, PC-posterior cingulate, PTRI-pars triangularis, ST-superior temporal gyrus, TP-temporal pole, TT-transverse temporal gyrus. The size of sphere denotes the value of mean BC across subjects within the group, the higher BC the bigger sphere.

