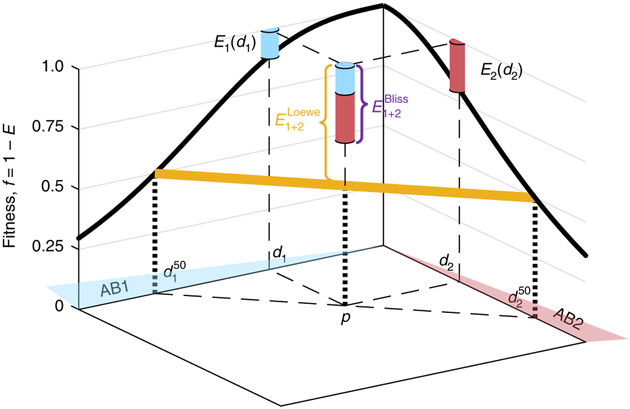
Fig. 1 |. Schematic depiction of effect additivity (Bliss) and dosage additivity (Loewe).
Given fitness as a function of dosage of each of the individual drugs (fi = 1 − Ei, dose response curve, black solid line), Bliss and Loewe models predict the fitness f1 + 2 = 1 − E1+2 at any given point P = [d1,d2] in the drug concentration space. The Bliss prediction assumes additivity of normalized drug effects, , where E1 and E2 are the individual drug effects at their cognate concentrations (cyan and red piles, respectively). The Loewe model, on the other hand, assumes additivity of normalized drug dosage, such that the combined drug effect is fixed along linear lines of constant total normalized dosage (yellow, equals 50% in the example point P, and more generally is given by solving for , where is the concentration of drug i that leads to inhibition level E).

