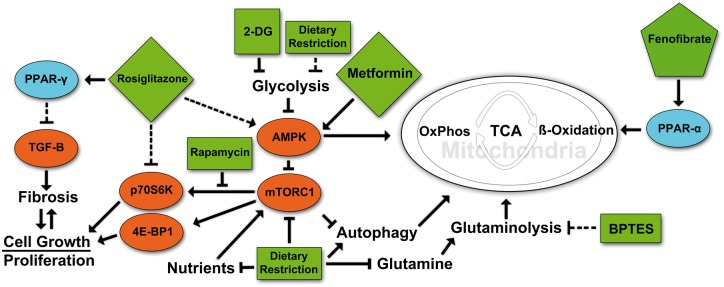
FIGURE 1.
Targeted metabolic regulation in ADPKD. A highly simplified cartoon of some of the major pathways that relate to the pathogenesis of PKD and that are are affected by some of the compounds discussed in this article. Rosiglitazone treatment activates PPAR-γ, causing heterodimeric binding to retinoid x receptor (RXR) followed by translocation to the nucleus, activating gene transcription of PPAR response element-regulated genes. This in turn leads to a decrease in TGF-β signaling and a subsequent reduction in fibrosis. Rosiglitazone also acts independently of PPAR-γ to inhibit p70S6K activation and ribosomal protein S6 phosphorylation. Treatment with 2DG leads to a reduction in glycolysis by inhibition of phosphoglucoisomerase. Decreased glycolytic activity in turn may cause the activation of AMPK and subsequent inhibition of mTORC1, cell growth and proliferation with an increase in fatty acid oxidation. Metformin activates AMPK that directly represses mTORC1 signaling via phosphorylation. Treatment with BPTES inhibits glutaminase (GLS1) disrupting the breakdown of glutamine to glutamate preventing it from being used in the TCA cycle to produce α-ketoglutarate. Fenofibrate treatment activates PPAR-α to bind to PPAR response elements and increase transcription of genes involved in fatty acid utilization, oxidative phosphorylation and mitochondrial biogenesis. Rapamycin inhibits the ability of mTORC1 to activate the S6-Kinase branch of its downstream pathway but has less effect on the 4E-BP1 branch. In contrast, mTOR kinase inhibitors or mTOR ASOs would affect both downstream branches. Dietary restriction simulates the effects of targeted drug therapies by reducing nutrient intake, leading to reductions in key regulatory pathways. Pointed arrowheads indicate activating effects. Blunt arrowheads indicate inhibitory effects. Dashed arrows indicate indirect or multistep effects.

