
FIGURE 5.
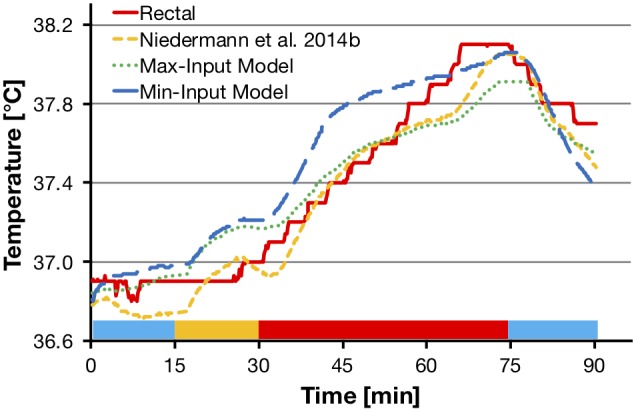
Comparisons of measured rectal temperature from heat session 1 (75% HR max cycling intensity, sports t-shirt and shorts) with the model from Niedermann et al. (2014b), the “Max-Input Model”, and the “Min-Input Model”, respectively. The graph shows a representative example from one participant. Colored bars at the bottom of the graph represent experimental phases as shown in Figure 2. HR max, maximal heart rate; Max-Input Model, prediction model using all measured non-invasive parameters; Min-Input Model, prediction model using only the most relevant measured non-invasive parameters; T, temperature.