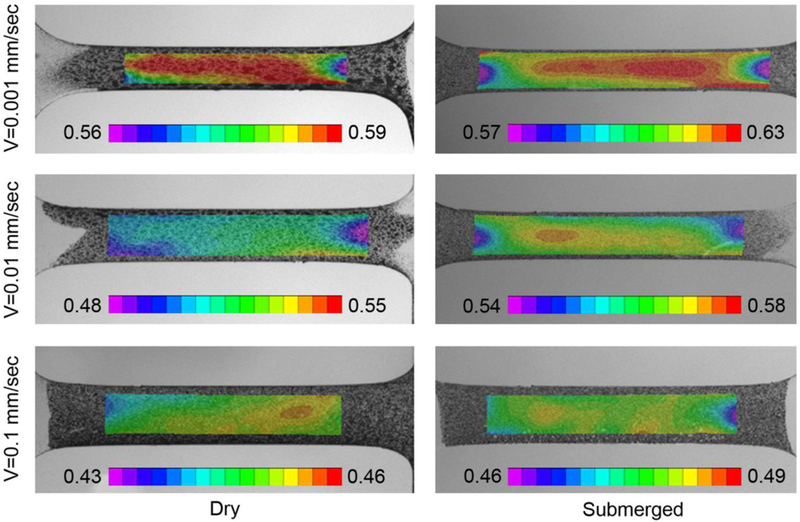
Fig. 2.

Effective strain distribution of uniaxial tensile samples for dry and wet conditions subjected to different stretching velocities. Colored scale bar indicates strain. (For interpretation of the references to color in this figure legend, the reader is referred to the web version of this article.)
