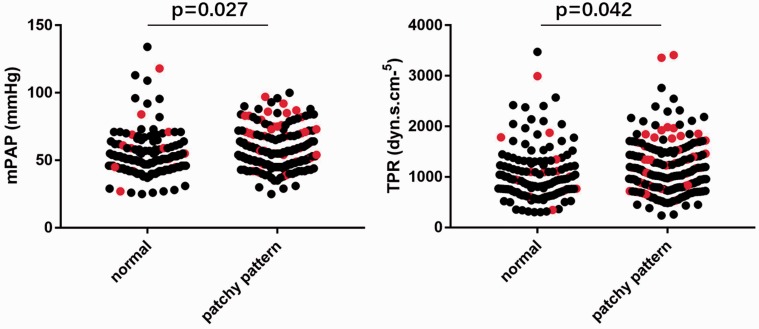
Fig. 2.
Distribution of mPAP and TPR values among patients with normal or patchy pattern. Differences in mPAP and TPR between two groups reached statistically significance (patchy pattern vs. normal, mPAP = 58.0 ± 15.4 mmHg vs. 54.1 ± 16.2 mmHg, P = 0.027; TPR = 1192.6 ± 533.7 dyn·s·cm–5 vs. 1067.2 ± 549.3 dyn·s·cm–5, P = 0.042). Red dots show patients who reached the primary endpoint of all-cause mortality.

