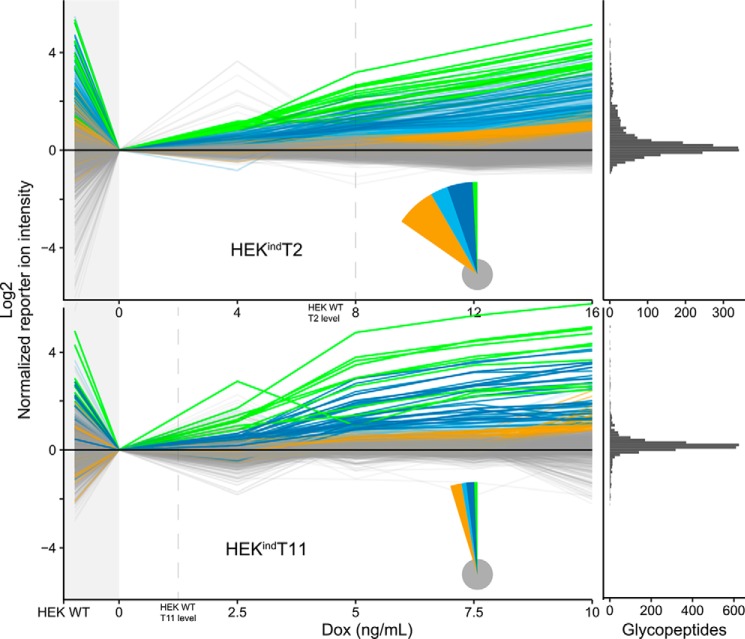
Figure 6.
Induced GalNAc-T2 and -T11 O-glycoproteomes. O-Glycopeptides identified and quantified by LC-MS/MS (2,440 for HEKindT2 and 2,743 for HEKindT11) across all six cultures are shown as line graphs. One line represents one O-glycopeptide. The TMT reporter ion intensities were normalized to the uninduced cells (0 ng/ml). HEK WT is shown to the left, followed by uninduced and four increasingly induced HEKindT2 or HEKindT11 cultures. O-Glycopeptides were grouped and colored based on the concentration of doxycycline (Dox) at which their normalized reporter ion intensity is >0.8 (log2 scaled). The green groups surpass at 4 ng/ml (HEKindT2) and 2.5 ng/ml (HEKindT11) respectively, dark blue at 8 and 5 ng/ml, light blue at 12 and 7.5 ng/ml, and orange at 16 and 10 ng/ml. Gray O-glycopeptides are unaffected by induction. The pie chart inset illustrates relative group sizes, and the marginal histogram to the far right shows the distribution of O-glycopeptides at the highest doxycycline concentration. The vertical dashed lines indicate at which concentration of doxycycline the respective cell lines reach cumulative HEK WT levels of the induced GalNAc-T, as quantified in the ratio check (Fig. 4). When inducing GalNAc-T2 or -T11, we observe an increase in glycosylation, selectively of their nonredundant substrate sites, whereas the global O-glycoproteome is unaffected (gray lines). There is a strong agreement between reporter ion intensities in HEK WT and the response of the intensities upon induction. O-Glycopeptides selectively lost when comparing uninduced cells to HEK WT are rescued by enzyme induction in HEKindT2 or HEKindT11. For GalNAc-T2, the data are representative of analysis of two independent inducible clones, and for GalNAc-T11, data represent analysis of one clone.

