Figure 1.
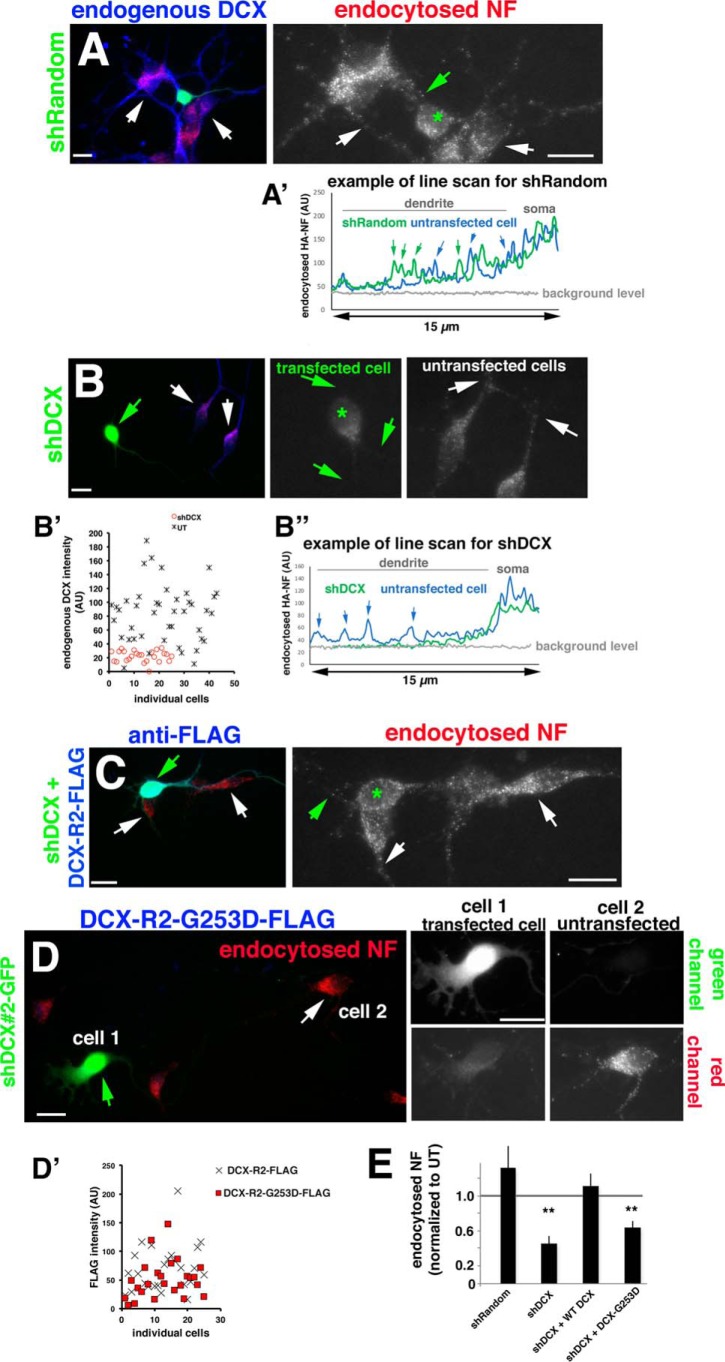
DCX-G253D fails to rescue NF endocytosis in primary neurons after DCX knockdown. A–D, endocytosis of endogenous NF (red) was determined in DIV3 hippocampal neurons expressing shRandom-GFP (A), shDcx#2-GFP (B), shDcx#2-GFP plus rescue plasmid WT DCX-R2-FLAG (blue) (C), and shDcx#2-GFP plus rescue plasmid DCX-R2-G253D-FLAG (blue) (D). Enlarged views of the red channel (endocytosed NF) are shown on the right in A–C. Green star, transfected cell; arrows in A–C, dendrites. An example of the brightness of NF-containing endosomes is shown as line scans for shRandom (A′) and shDcx (B″) for transfected (green line) and untransfected cells (blue line). Arrows, peaks corresponding to endosomes along the dendrite. B′, levels of endogenous DCX were plotted for untransfected cells (UT; black crosses) and cells expressing shDcx#2-GFP (red circles). For D, cell 1 (green arrows) corresponds to a transfected cell, and cell 2 (white arrows) corresponds to an untransfected cell. Corresponding green and red channels are shown on the right. Scale bars, 20 μm. D′, DCX-R2-FLAG (cross) and DCX-R2-G253D-FLAG (red square) are expressed at comparable levels in transfected neurons. n = 25 cells for each plasmid. Transfected cultures were also counterstained with antibody against DCX to evaluate the extent of overexpression compared with untransfected cells (Fig. S1). E, quantification of NF endocytosis levels for conditions shown in A–D. Quantification of one representative experiment is shown. Measurements are normalized to untransfected (UT) cells in the same field. n = 15–25 cells/condition/experiment. Error bars, S.E. **, p < 0.001 (ANOVA with post hoc test).

