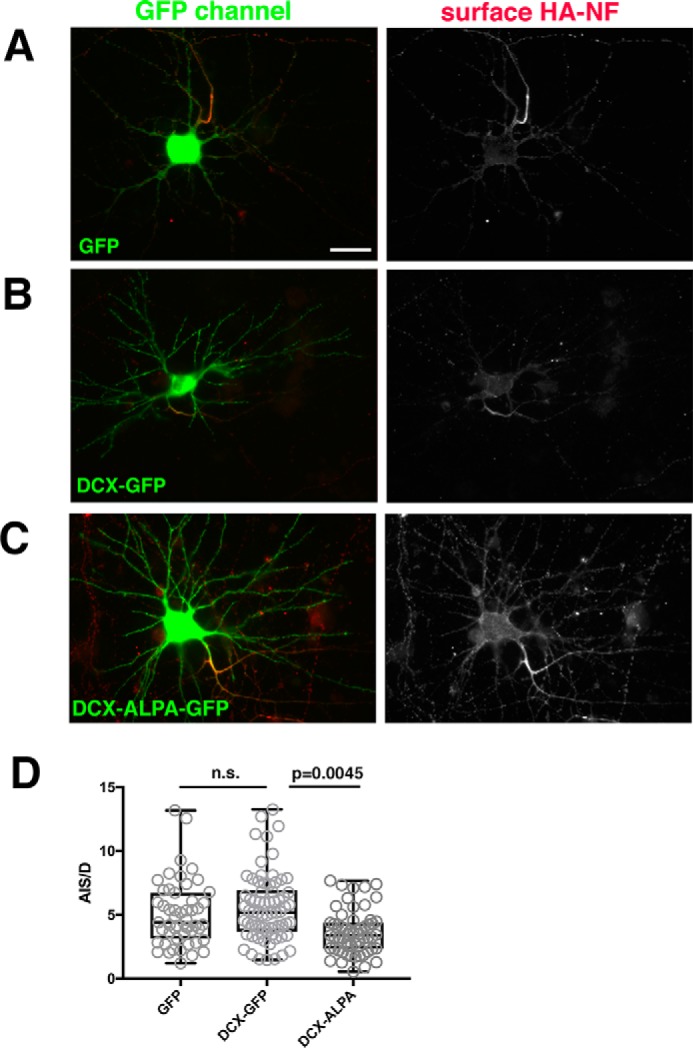
Figure 5.

Co-expression of DCX-ALPA interferes with HA-NF accumulation on the AIS. A–C, HA-NF (red) accumulates predominantly at the surface of the AIS in cells expressing GFP as a control (A) or DCX-GFP (B), but HA-NF mislocalizes to the somatic and dendritic surface when DCX-ALPA-GFP is expressed (C). The right panels show single-channel images of the HA-NF surface distributions (DIV9 neurons 20 h post-transfection). Scale bar, 20 μm. Transfected cultures were also counterstained with antibody against DCX to compare the extent of overexpression compared with control cells expressing GFP (Fig. S1). D, surface distribution of HA-NF was quantified by determining the surface intensity of HA-NF on the AIS versus dendrites (AIS/D PI) for neurons expressing GFP, DCX-GFP, or DCX-ALPA-GFP. ***, p < 0.0001; n.s., not significant. One representative experiment is shown (of a total of three independent experiments). n = 51 cells for GFP, 70 cells for DCX-GFP, and 59 cells for DCX-ALPA. Whisker plots show the median as a line, 25–75% as a box, and the data range as whiskers (Kruskal–Wallis test; p = 0.0045 for DCX-GFP versus DCX-ALPA; p = 0.0014 for GFP versus DCX-ALPA).
