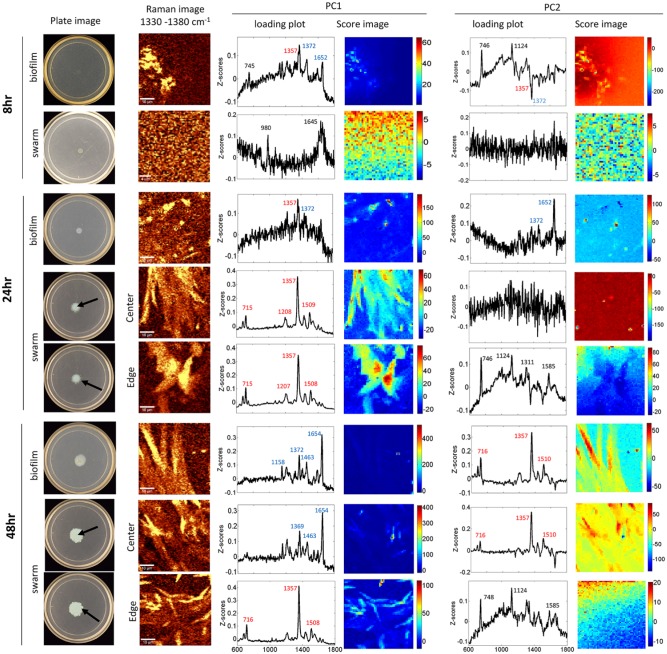
Figure 1.
Pseudomonas aeruginosa biofilms and swarms present different chemical signals at different time points. The plate images shows the swarming motility and biofilm colonies on agar-based assays incubated for 8, 24, and 48 hours. Plate assays were analyzed directly by combining CRM (Raman image includes both PQS and AQNO subclasses) and PCA analysis (loading plots and score images for PC1 and PC2) to identify chemical features within the samples. Representative CRM results (n ⩾ 3) collected from biofilm samples and swarm regions both near and away from inoculation center are shown. Scale bars on Raman images represent 10 µm. Loading plots for PC1 and PC2 include features corresponding to tabulated features from Raman spectra of cellular and matrix components (black), PQS/C9-PQS (blue), and AQNOs (HQNO/NQNO; red). Score images of PC1 and PC2 show the distribution of each of the principal components.

