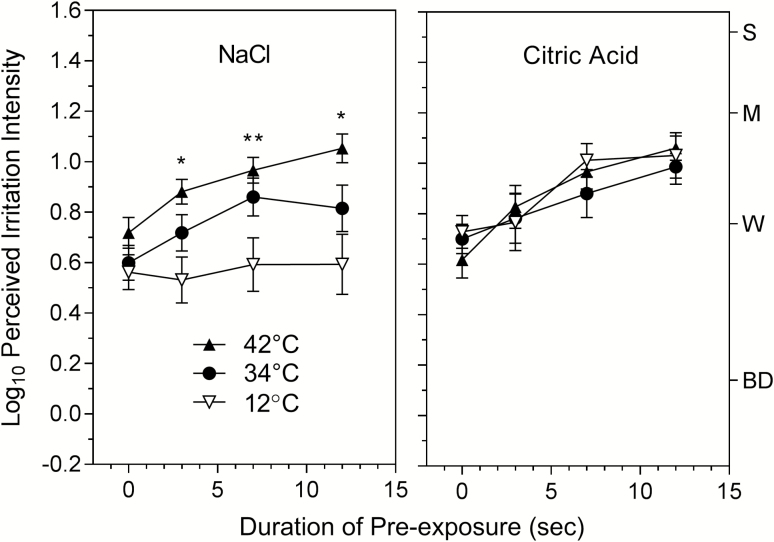
Figure 3.
Shown are the log10-mean ratings of the perceived intensity of sensory irritation produced by NaCl and citric acid at 3 different solution temperatures as a function of the duration of pre-exposure to the same stimulus. Sensitization was significant for both stimuli but was significantly affected by temperature only for NaCl. Asterisks indicate significant differences (Tukey HSD, P < 0.05) in sensitization between 12 and 42°C only (*) and between 12 and both 34 and 42 °C (**). Letters on the right y axis denote semantic labels of perceived intensity on the gLMS: BD = barely detectable; W = weak; M = moderate; S = strong. Vertical lines represent the standard errors of the means.

