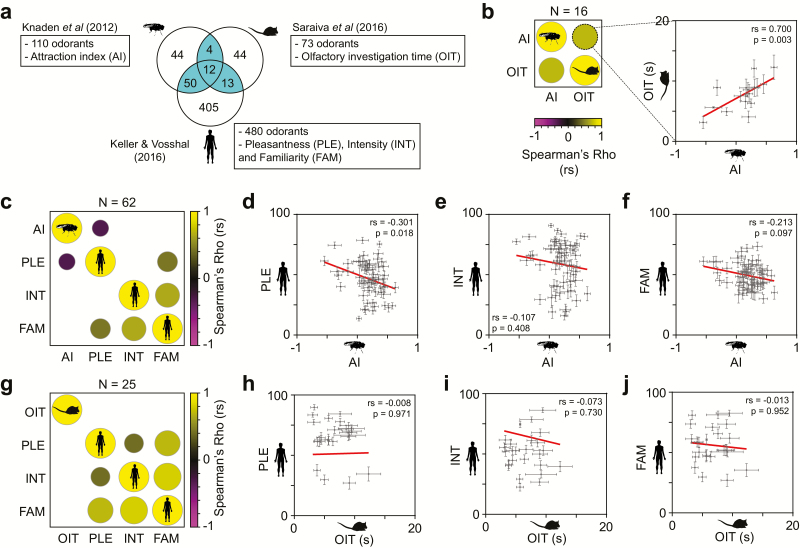
Figure 1.
Interspecific differences of odor valence in fruit flies, mice, and humans. (a) Study design: the Venn diagram indicates the number of odorants (highlighted in ocean blue) for which odor valence scores overlap in flies (Knaden et al. 2012), mice (Saraiva et al. 2016), and humans (Keller and Vosshall 2016). For each species, the name and abbreviation of the parameters measured are specified as follows: fly attraction index (AI), mouse olfactory investigation time (OIT) and human-rated pleasantness (PLE), intensity (INT), and familiarity (FAM). (b) Correlogram matrix (left) and correlation plot (right) comparing the fly AI with mouse OIT for the 16 overlapping odorants. (c) Correlogram for the 62 overlapping odorants between fly AI and the human PLE, INT, and FAM. To the right are the corresponding correlation plots between fly AI and human-rated PLE (d), INT (e), and FAM (f). (g) Correlogram for the 25 overlapping odorants between mice OIT and humans PLE, INT, and FAM. To the right are the corresponding correlation plots between mouse OIT and human-rated PLE (h), INT (i), and FAM (j). In all correlograms, only significant (P < 0.05) correlations are plotted, and the circle size and color indicate the magnitude and direction of the correlation (Spearman rho, rs). Blank cells correspond to nonsignificant correlations.

