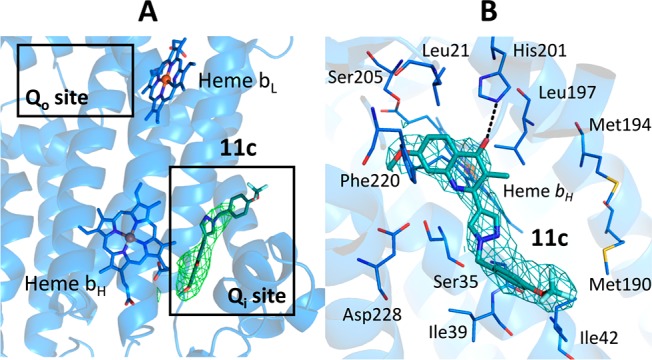
Figure 2.

Cytochrome bc1 Qi site (bovine heart derived) bound inhibitor 11c. (A) The omit Fo–Fc map (green) contoured at 3σ level around 11c (teal) compounds shown as sticks. The cartoon representation of cytochrome b subunit is shown in blue. The Qi and Qo sites are marked by black boxes. (B) The 2Fo–Fc electron density map (cyan) contoured at 1σ level around the inhibitors. Surrounding residues are drawn as blue lines and hydrogen bonds as black dashed lines.
