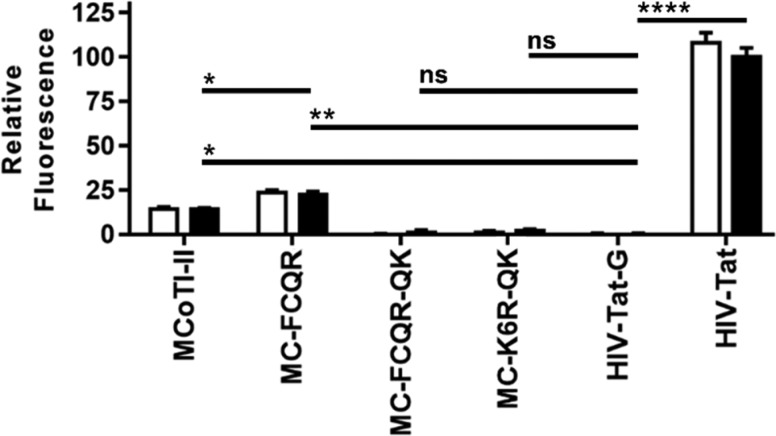
Figure 3.
Peptide internalization into HeLa cells quantified by flow cytometry. The relative mean fluorescence of MCoTI-II and MCoTI-variants (4 μM) was measured before (white bars) and after (black bars) the addition of trypan blue and was normalized to the positive control HIV-TAT peptide (post-trypan blue). Statistical significance was determined using one-way ANOVA with Tukey’s post hoc test. Three independent experiments were performed, and error bars represent the standard deviation. * = p-value <0.05, ** = p-value <0.005, **** = p-value <0.00005, and ns = not significant.

