. 2018 Jun 19;14(31):6431–6438. doi: 10.1039/c8sm00751a

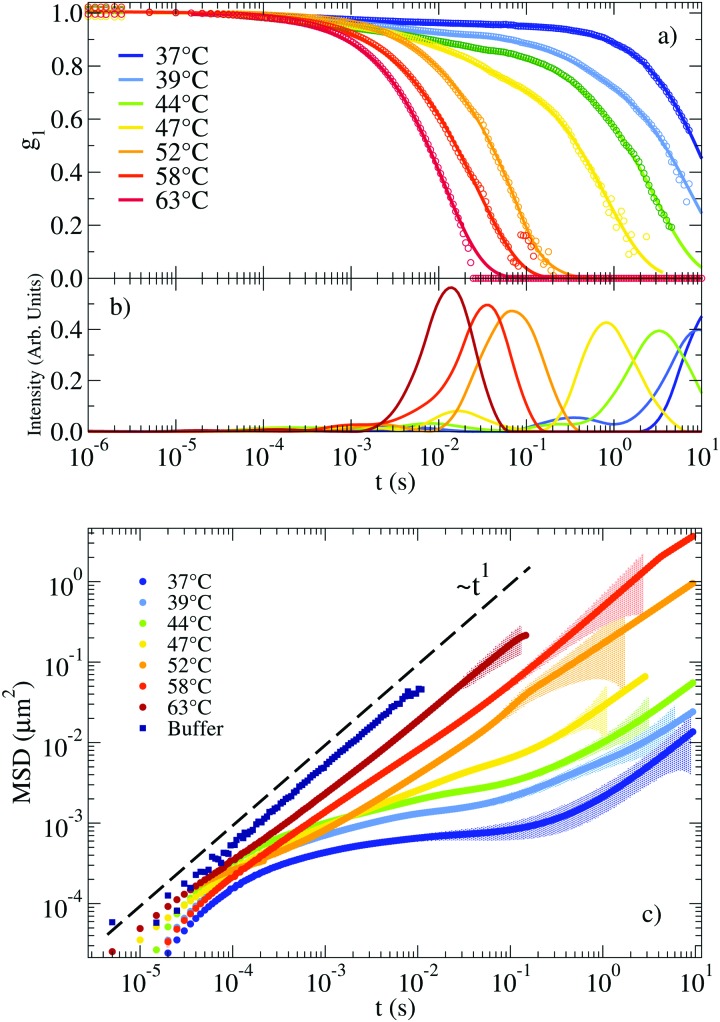
Fig. 2. (a) Autocorrelation functions measuring the motion of a probe particle immersed in a NS solution at a concentration of 248 μM. Experimental data is represented by circles. Solid lines indicate the result of applying CONTIN to the experimental g1(t). (b) Corresponding distribution of relaxation times as calculated from CONTIN. (c) Corresponding MSD of the probe particles (symbols). The coloured shadow backgrounds represent the statistical error calculated following Section V of the ESI. The errors are not shown for values ΔMSD(t)/MSD(t) > 1. The figure also shows for comparison the MSD of the same tracers dispersed in a buffer of H2O and 100 mM NaCl (see Section I of the ESI).

Fig. 2