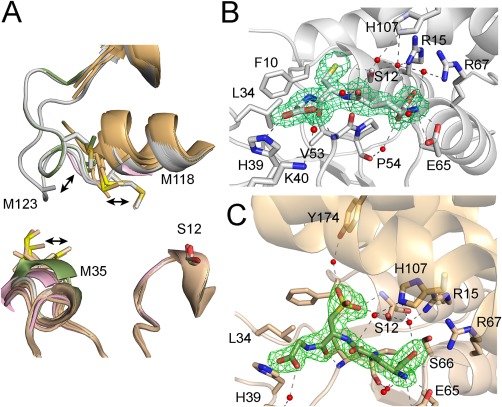
Figure 4.

Oxidation leads to GSTF9 H‐site disorder and oxidized glutathione (GSO3) formation in the G‐site. (A) Overlay of the 10 copies of GSTF9 in the AU of GSTF9ox (shown in gold cartoon) and the two chains present in the AUs of both the GSTF9red (chain A and B in gray cartoon) and GSTF9_H2O2+NaOCl structures (chain A in pink, chain B in green) shows a high mobility for the α2‐β2 and especially the α4‐α5 loops. Residues 120–127 in the latter loop become entirely disordered in the GSTF9ox structure, as well as in chain A of the GSTF9_ H2O2+NaOCl structure. The side chains of Met35, Met118 and Met123 shown in sticks are highly mobile. (B‐C) The active site H‐bond network of GSFT9red (gray cartoon) has a GSH molecule (B), which is oxidized to GSO3 (C) within the GSTF9ox G‐site (gold cartoon). The residues (gold for GSTF9ox and gray for GSTF9red) interacting with GSH and GSO3 are shown in stick representation. Leu34 and Phe10 delineate the G‐site. Hydrogen bonds are in gray or black dashed lines. Water molecules H‐bonded to GSH or GSO3 are in red spheres. An omit map contouring the ligands, GSH and GSO3, at 3σ is shown in green.
