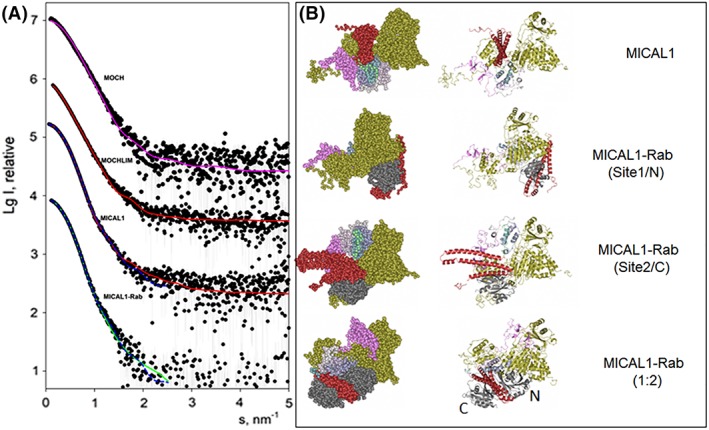
Figure 8.

SAXS‐based modelling of MICAL1 and its complexes with Rab8.GppNHp. Panel A presents the experimental SAXS data depicted as dots, and the computed curves from the structural models in panel B shown as lines. The fit of the experimental scattering from MOCH by that computed from the monomeric structure of MOCH (PDB ID: 4TXI 34, Fig. 1) is displayed as magenta line. The simultaneous fits of the scattering from MOCHLIM and MICAL1 by a model of MICAL1 (panel B, top) are shown as red solid lines. The results of the simultaneous fitting of the scattering from MICAL1 and MICAL1‐Rab8.GppNHp complex assuming 1:1 stoichiometry are displayed as blue dashed lines; the two complexes with Rab8 binding to Sites 1 and 2 are shown in (B, middle). The best fit from a MICAL1‐Rab8.GppNHp with 1:2 stoichiometry (B, bottom) is displayed as a green solid line. The successive curves in panel A are displaced down by one logarithmic unit for better visualization. In the right panels the color scheme is as follows: gold, MOCH (4TXI); pink, LIM (2CO8); shaded from light to dark sea green: globular domain predicted by Robetta modeling (GD in Fig. 1); red, MICAL1 RBD (extracted from 5LPN); grey: Rab (extracted from 5LPN). In the lower panel, N and C indicate the position of Rab with respect to the two binding sites detected with the isolated RBD (5LPN).
