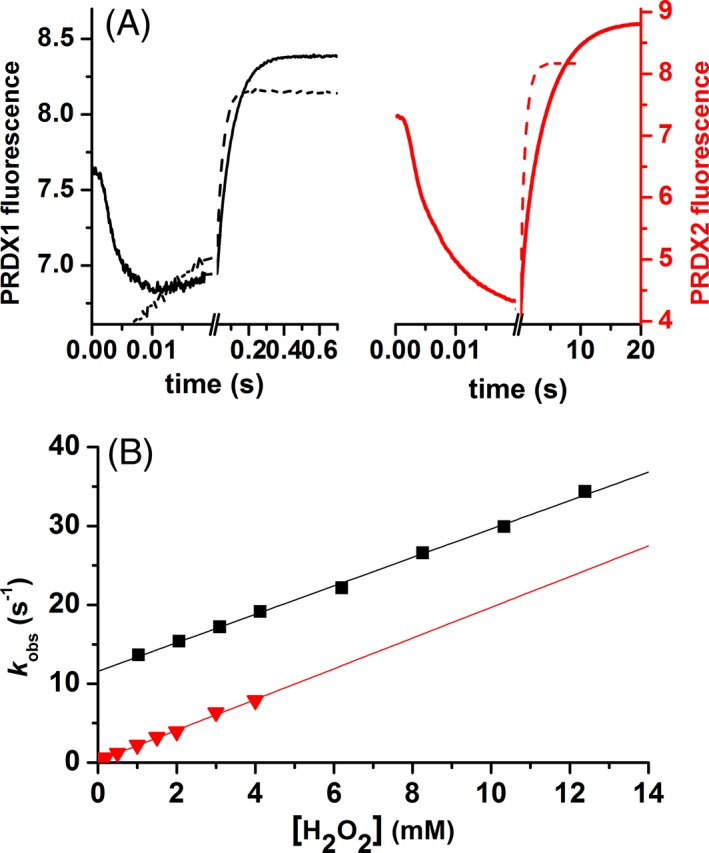
Figure 2.

Kinetics of PRDX1 and PRDX2 oxidation by H2O2. (A) Time course of the intrinsic fluorescence of 0.25 μM PRDX1 (black line) or 0.25 μM PRDX2 (red line) upon oxidation with 1.25 μM or 1.5 μM H2O2, respectively (solid line) and 1 mM H2O2 (dashed line) in both cases, at pH 7.4 (traces are the average from 15 runs). (B) The slower phase was fitted to a single exponential function and the first‐order rate constant (k obs) plotted as a function of H2O2 concentration. PRDX1 (black squares) and PRDX2 (red triangles).
