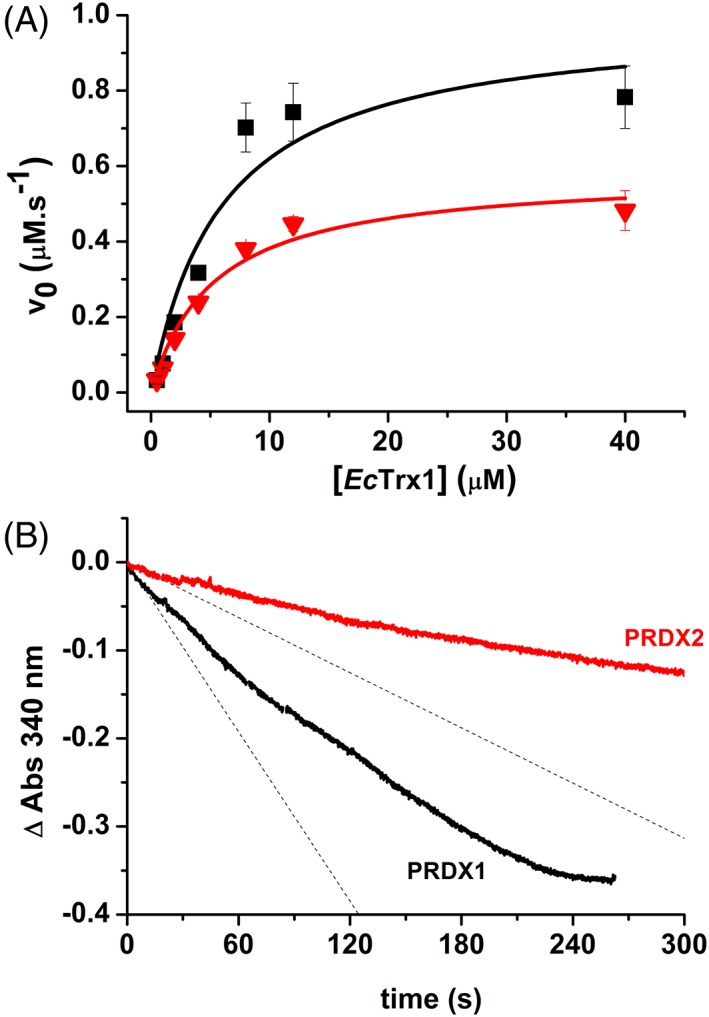
Figure 3.

NADPH‐linked peroxidase activity. (a) Determination of kinetic parameters (k cat, K M): reduction of H2O2 catalyzed by PRDX1 (black squares) or PRDX2 (red triangles) was monitored at different initial EcTrx1 concentrations with 200 μM NADPH, 1 μM EcTR, 0.5 μM PRDX1 or PRDX2 and 10 μM H2O2 in 50 mM phosphate buffer pH 7.4, 150 mM NaCl. NADPH oxidation was monitored at 340 nm. Experimental data was fitted to Michaelis–Menten equation (solid lines). (b) Representative time trace of H2O2‐dependent NADPH oxidation by the Prx/Trx/TR system at 50 μM H2O2. Reaction mixture contained 200 μM NADPH, 1 μM EcTR, 8 μM EcTrx1, 0.5 μM PRDX1 (black trace) or PRDX2 (red trace) in 50 mM phosphate buffer pH 7.4, 150 mM NaCl and the reaction was started by addition of H2O2. Dashed lines represent the initial slope of the reaction.
