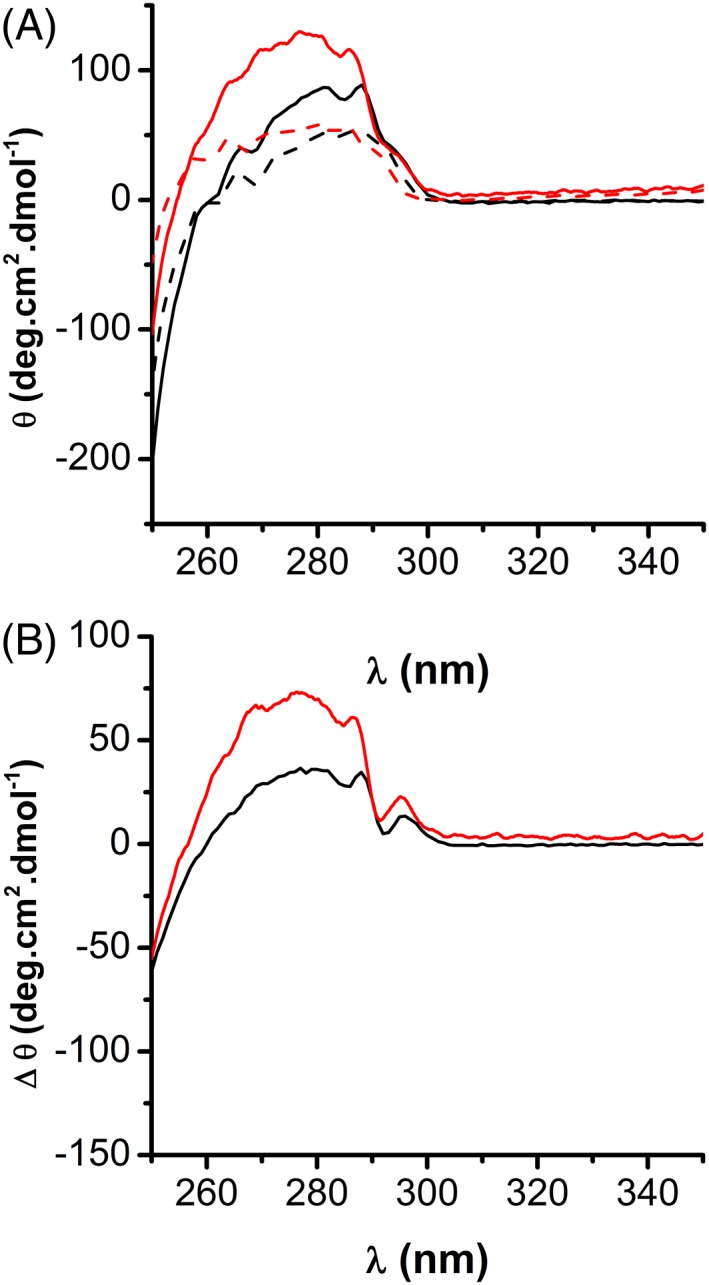
Figure 8.

Comparison of Near‐UV CD spectra of PRDX1 and PRDX2. (a) About 50 μM PRDX1 (black) or PRDX2 (red) in their reduced or oxidized state (solid and dashed lines, respectively) was analyzed by CD in the near UV. (b) Reduced disulfide‐oxidized differential CD spectra for PRDX1 (black line) and PRDX2 (red line) showing less differences in near‐UV CD signals on PRDX1 compared to PRDX2 upon oxidation, compatible with small changes in the surroundings of aromatic residues in the former.
