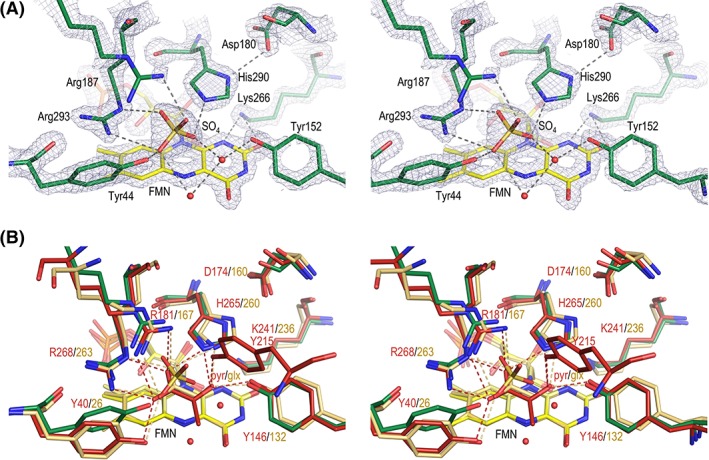
Figure 4.

Active site of LMO. (A) Electron density map quality and active site of LMO. Stereoview of the LMO active site residues (green carbons), FMN (yellow carbons), sulfate, and ordered waters (red spheres) with 2F o–F c electron density (grey; contoured at 3.5ρ rms). Select hydrogen bonds (dashed line) are shown. Arg187 has an alternate conformation, but only the A conformation (50%) interacting with the sulfate is shown. The view roughly matches that shown in Figure 1(B) schematic. (B) Active site overlay of LMO with LOX and GOX. Stereoview of the LMO active site (colored as in Fig. 4) compared with LOX with bound pyruvate (red carbons; PDB entry 2E77) and GOX with bound glyoxylate (tan carbons; PDB entry 2RDU). Hydrogen bonds (dashed line) between active site side chains and the ligand in LOX (red) and GOX (beige) are shown.
