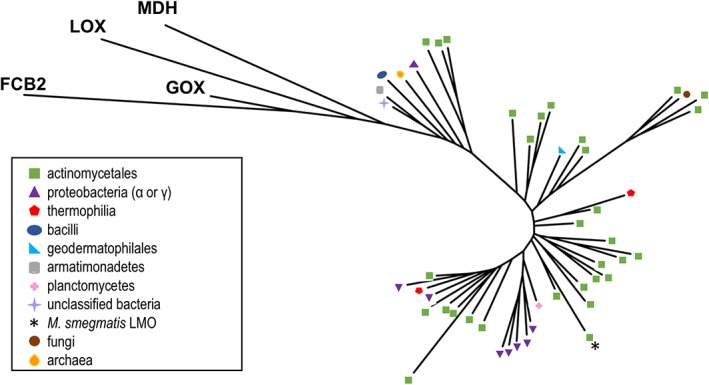
Figure 8.

Relatedness tree and distribution of putative LMOs and representative α‐hydroxy acid oxidases. An unrooted tree is shown for the 48 representative putative LMO sequences along with proteins from representative PDB entries from LOX (PDB entry 2E77), GOX (2RDU), MDH (1P4C), and FCB2 (1KBI). The branches for the putative LMO sequences are annotated by symbols according to the organism where they are found, with a key in the figure indicating which symbols correspond to which organisms.
