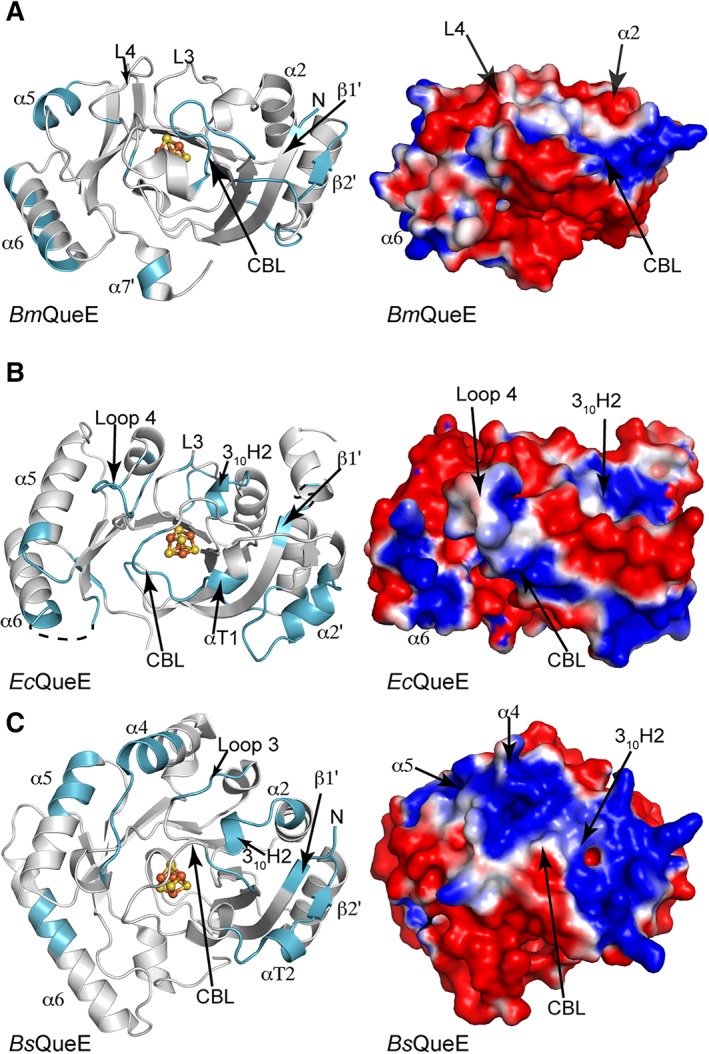
Figure 9.

QueE orthologs show differential electrostatic surfaces. Ribbon drawing of QueE orthologs, shown as monomers in grey, with the structural elements contributing to the positive electrostatic surface highlighted in cyan. The electrostatic surface potential is shown colored from red to blue for −1 to +1 kTe−1 on the right of each panel for the corresponding orientation of the QueE orthologs. (A) BmQueE, (B) EcQueE, and (C) BsQueE.
