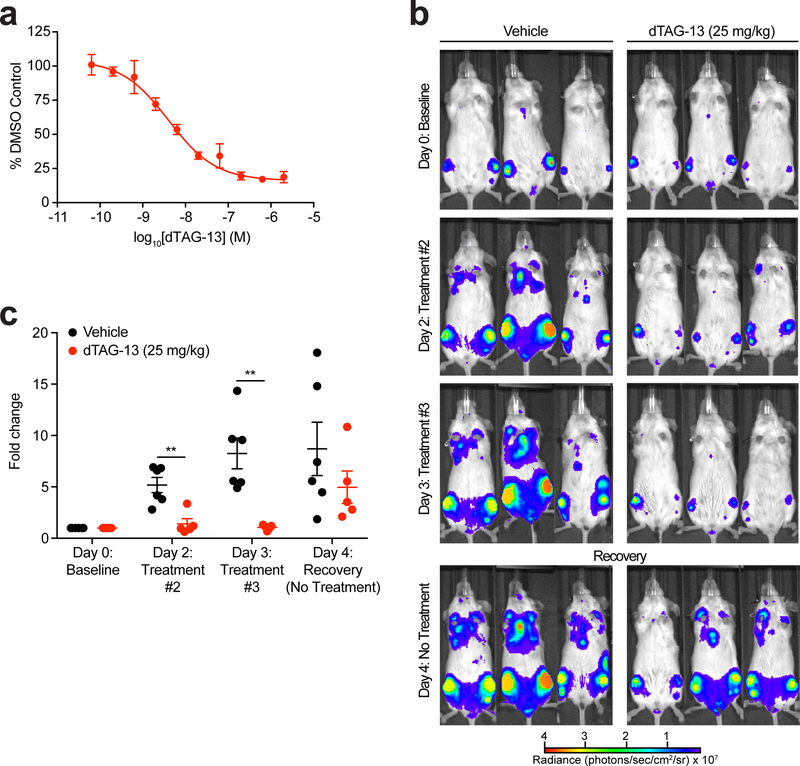
Figure 6 |. Evaluation of rapid and reversible degradation in vivo.
(a) DMSO normalized ratio of Fluc signal of MV4;11 cells expressing luciferase-FKBP12F36V treated with dTAG-13 for 16 hours. Data are presented as mean ± s.d. of n = 4 biologically independent samples and are representative of n = 3 independent experiments. (b) Images of average radiance of vehicle (n = 6 biologically independent mice) or dTAG-13 (n = 5 biologically independent mice) treated mice. Three representative mice are shown and the same mouse is shown on the same scale at each time-point. (c) Fold change in average radiance of each mouse normalized to baseline signal at Day 0 of vehicle (n = 6 biologically independent mice) or dTAG-13 (n = 5 biologically independent mice) treated mice. P value derived from a two-tailed Welch’s t-test. ** P < 0.01 (P = 0.0025 for Day 2 and P = 0.0048 for Day 3).

