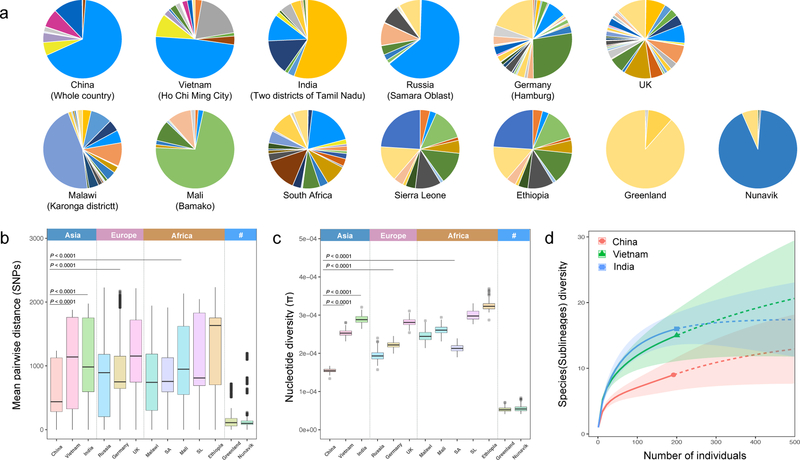
Fig. 2. Low genetic diversity in China’s MTBC population.
(a) Pie charts showing the relative prevalences of MTBC sublineages in different countries, where each sublineage is assigned a color according to a recent defining scheme. Mean pairwise SNP distance between MTBC strains (b), nucleotide diversity (π) in MTBC population (c) from each country/region/population. “SA” refers to South Africa, “SL” refers to Sierra Leone, and 95% confidence intervals are shown. (d) Rarefaction analysis predicted the sublineage diversity of MTBC population in China, India, and Vietnam. Two hundred isolates were randomly sampled from each of the three countries; solid lines show the captured sublineages while the dashed lines show the predicted changes as the sample size is increased.

