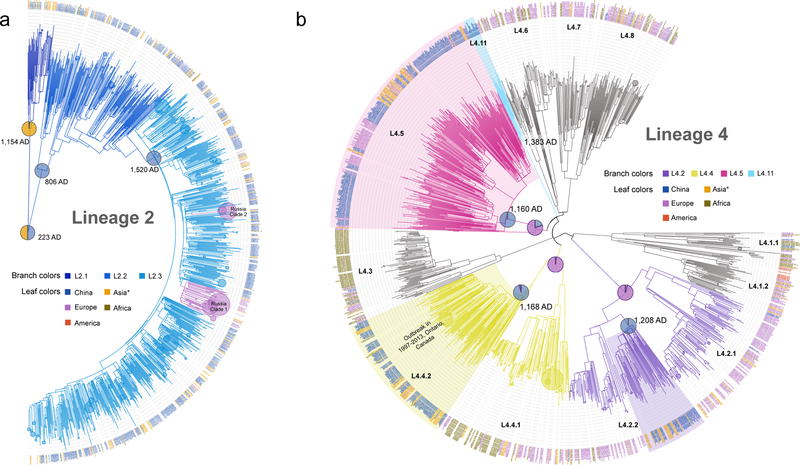
Fig. 3. Single origins of the four indigenous genotypes.
The phylogenetic trees of lineage 2 (a) and lineage 4 (b) were reconstructed with 1,242 isolates and 1,569 isolates respectively. To reduce the complexity in both trees, terminal branches with branch length < 0.008 (indicating clusters diversified very recently, e.g. the two Russian clades in L2.3) were automatically collapsed into circles. The circle sizes of those collapsed branches were proportional to the number of leaves that were collapsed. The estimated origin times of indigenous genotypes are shown at the relevant nodes, and their inferred geographic states are shown as pies with the colors indicating the isolates’ country origin. Asia* refers to Asian countries and regions excluding China. The three dominant clades of L4 in China were highlighted.

