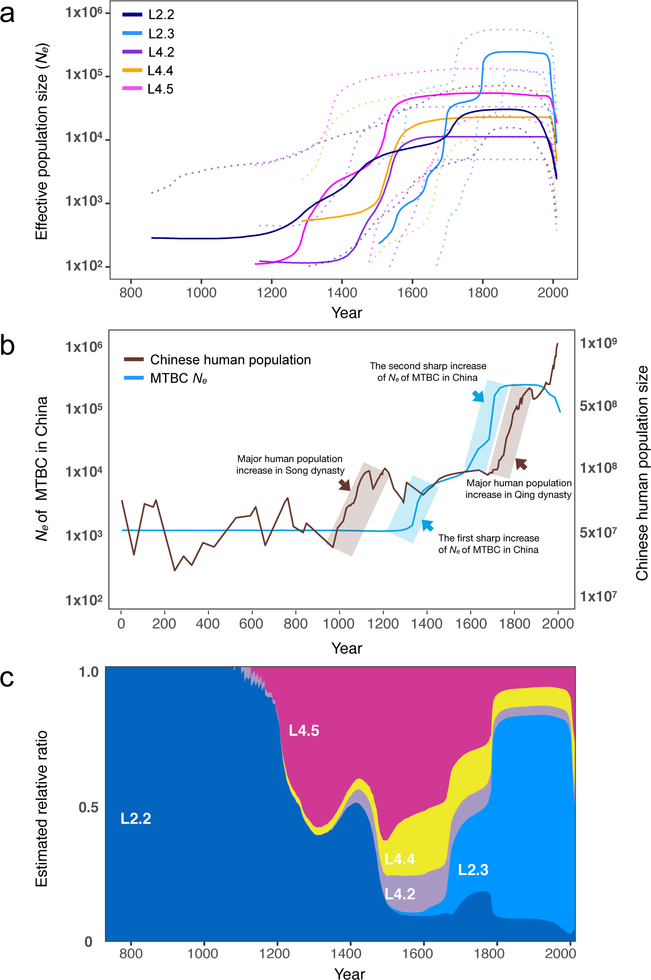
Fig. 4. Historical expansions of indigenous MTBC genotypes.
(a) Estimated effective population size changes of the major MTBC sublineages in China. L2.3 was separated from L2.2 in Bayesian Skyline Plot analysis, and the dashed lines represent the 95% HPD. (b) Comparison of Chinese human population growth curve and MTBC Ne curve (all indigenous genotypes). (c) The inferred past population dynamics of each sublineage in China estimated from the effective population growth.

