
Figure 4.
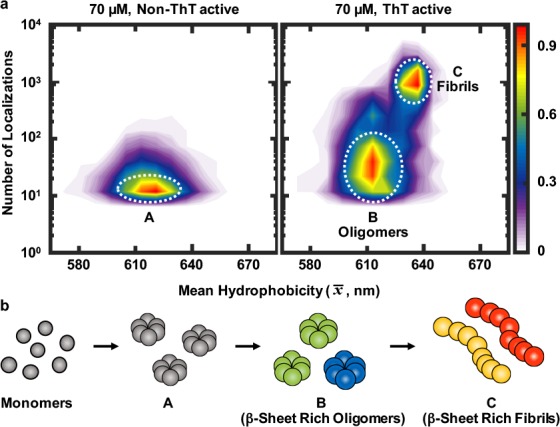
Probing hydrophobicity changes between non-ThT active and ThT active αS species (a) Hydrophobicity landscapes of non-ThT active and ThT active species from all time points for the 70 μM αS aggregation. (Lookup table: population density.) (b) Cartoon showing αS protein aggregation; each αS species in (A), (B), and (C) corresponds to the αS species indicated by the area in a white circle area in (a). (A) Non-ThT active small oligomers, (B) ThT active, β-sheet rich larger oligomers, and (C) ThT active, β-sheet rich fibrils.