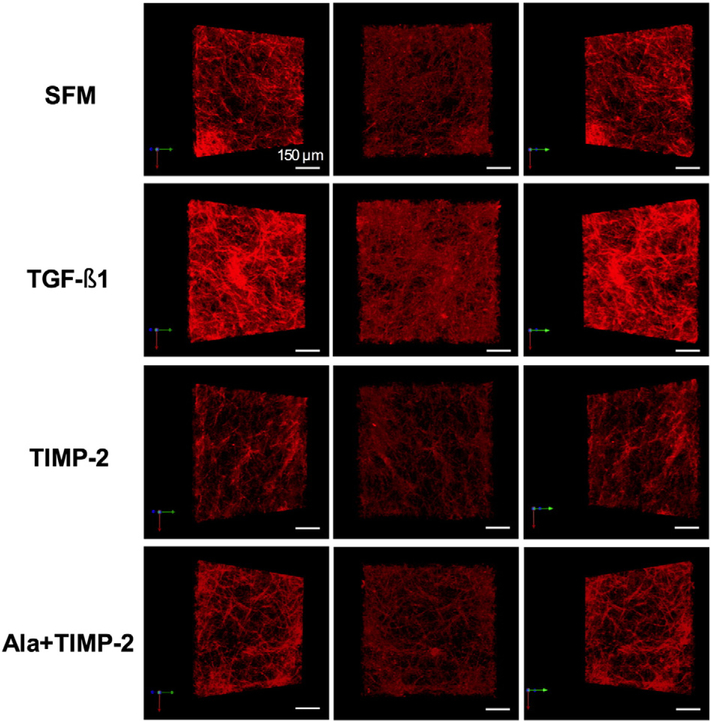
Fig. 5.
3D collagen matrix architecture. 3D images of collagen ECM architecture were reconstructed. Each row consists of three different projections of one representative image of a cell–ECM construct for each treatment group. Scale bar=150 μm. Top row: SFM group, which represents the baseline state with an assumption that ECM homeostasis is maintained (negative control). Second row: TGF-beta1 increased collagen fibril density in the cell–ECM construct showing a net accumulation of collagen (fibrosis) relative to the SFM control. Third row: TIMP-2 did not increase the density of collagen, instead a modest amount of ECM degradation was observed as compared to SFM. Bottom row: Ala+TIMP-2 did not significantly alter the collagen ECM architecture as compared to SFM.

