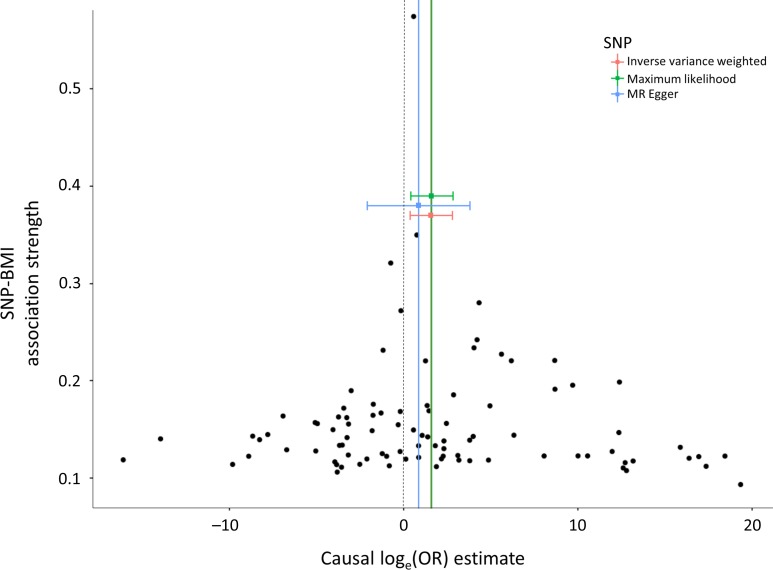
Figure 1.
Funnel plots showing the causal effect estimates of BMI on PCOS. Black dots represent the causal effect estimates for each of the 92 SNPs. The three colored squares represent the causal effect estimates from the three MR methods, with corresponding horizontal lines displaying the 95% confidence intervals.

