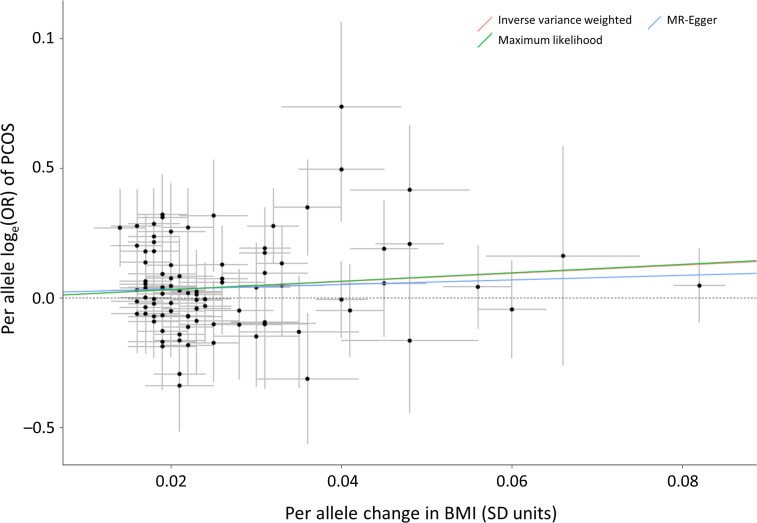
Figure 2.
Individual effects of 92 genetic variants on BMI and the odds of PCOS. The effect size in the entire cohort of each of the 92 SNPs on BMI (in standard deviation (SD) units) is on the X-axis. The loge odds ratio of each SNP for PCOS is on the Y-axis. The trend lines represent the results of the three MR analyses based on the 92 SNPs.

