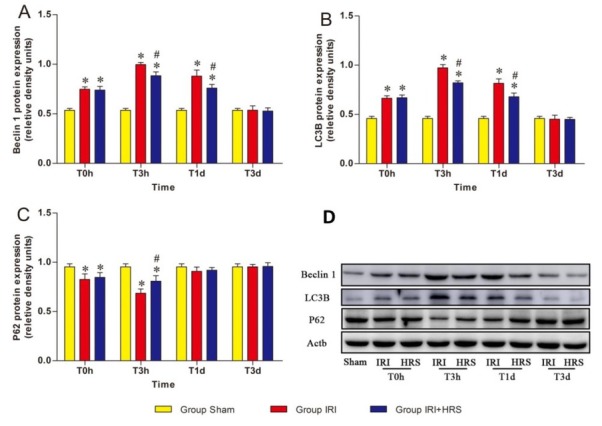
Fig. 5.

Expression levels of Beclin1 (A), LC3B (B), and p62 (C) proteins in the three groups measured by Western blot. (D) Western blot results. Values are mean ±standard deviation. * Significant difference from sham group. # Significant difference of IRI + HRS group from IRI group
