
Fig. 6.
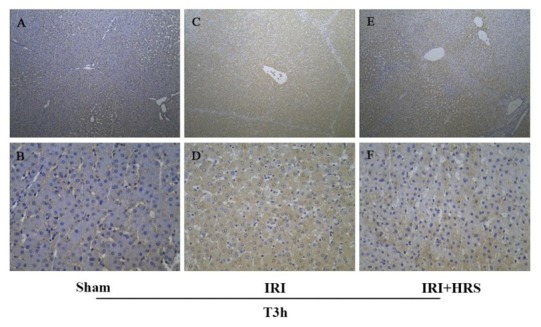
Liver. The results of IHC of LC3B at T3h; A and B – sham group; C and D – IRI group; E and F – IRI + HRS group. The images A, C, and E were recorded at 100× magnification, and the images B, D, and F were recorded at 400× magnification
Official websites use .gov
A
.gov website belongs to an official
government organization in the United States.
Secure .gov websites use HTTPS
A lock (
) or https:// means you've safely
connected to the .gov website. Share sensitive
information only on official, secure websites.
Liver. The results of IHC of LC3B at T3h; A and B – sham group; C and D – IRI group; E and F – IRI + HRS group. The images A, C, and E were recorded at 100× magnification, and the images B, D, and F were recorded at 400× magnification