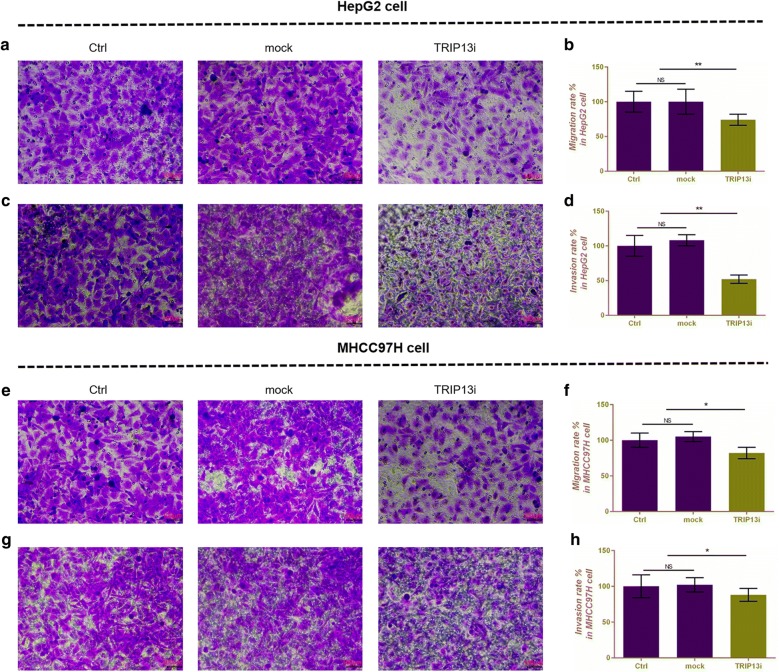
Fig. 4.
The effects of silencing TRIP13 on cell migration and invasion in HepG2 and MHCC97H cells. Transwell assay was performed to detect the effects of silencing TRIP13 on cell migration (a) and invasion (c) in HepG2 cells. Migration (b) and invasion (d) rate was shown as bar diagrams in HepG2 cells. Transwell assay was performed to detect the effects of silencing TRIP13 on cell migration (e) and invasion (g) in MHCC97H cells. Migration (f) and invasion (h) rate was shown as bar diagrams in MHCC97H cells. Data were expressed as mean ± SD from three independent experiments (*compared with control or mock, *P < 0.05, **P < 0.01)

