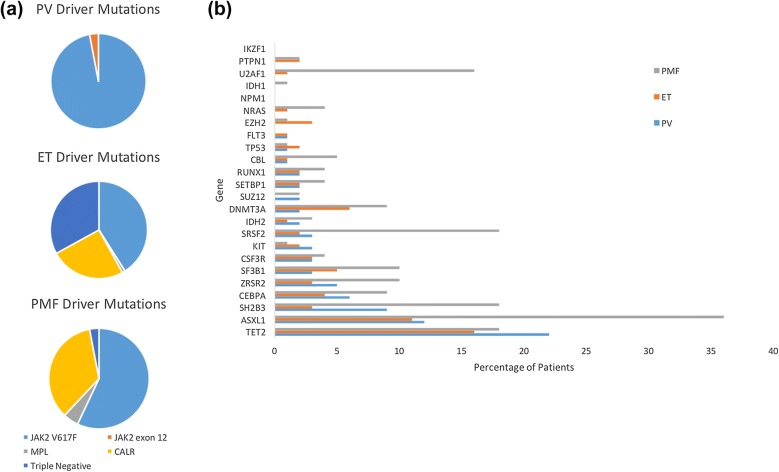
Fig. 1.
a This demonstrates the relative proportions of driver gene mutation observed in each MPN phenotype. b This demonstrates the proportion of patients with each MPN phenotype with a mutations in a panel of genes commonly mutated in myeloid malignancy. Frequency of mutations presented is based on data acquired in by Tefferi et al. [34, 35]

