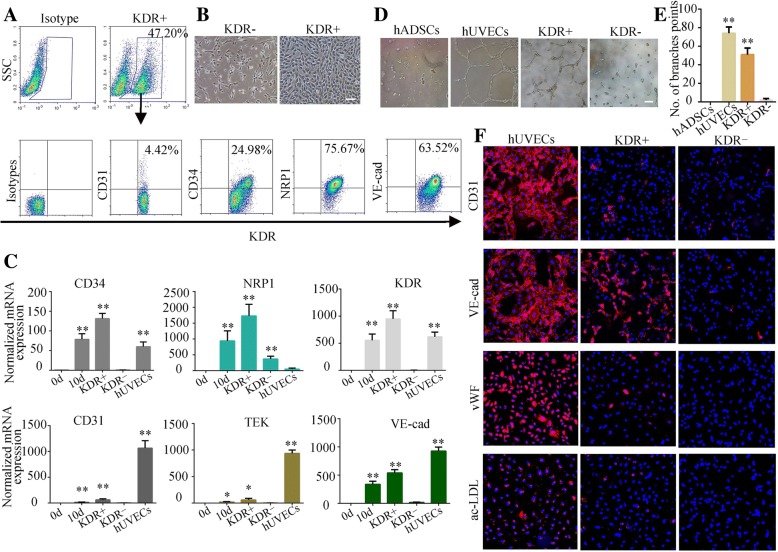
Fig. 2.
Isolation and characterization of KDR+ cells. a Phenotypic analysis of KDR+ cells after sorting. b Typical cell morphology of KDR− cells (left) and KDR+ cells (right). c mRNA levels of endothelial-specific genes were determined by quantitative RT-PCR on induced ETV2-hADSCs at day 10; the results of unsorted cells and the purified KDR+ and KDR− cells were shown. Data are normalized to β-actin. d KDR+ cells, similar to hUVECs, were able to form tubular structures on Matrigel-coated plates. e The number of branches were quantified (n = 5). f Immunofluorescence of endothelial markers CD31, VE-cad, vWF, and ac-LDL uptake were detected in KDR+ and KDR− cells; hUVECs were used as positive control. Scale bar = 50 μm. *P < 0.05, **P < 0.01

