Fig. 3.
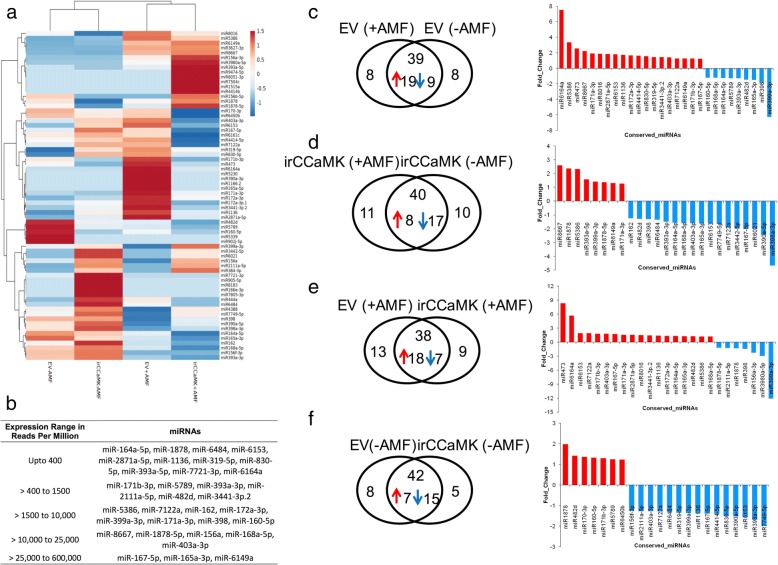
Differential abundance of conserved miRNAs in EV and irCCaMK plants by AMF inoculation. a Unsupervised hierarchical clustering of normalized miRNA abundance values was performed using Pearson correlation and the average linkage method. Row values were centered and scaled using the unit variance scaling method. More abundant miRNAs are shown in red and less abundant ones are shown in blue. Differential accumulation of multiple miRNAs between the conditions was observed. b Na-miRNAs show a wide range of abundance patterns. The majority of the Na-miRNAs found in all four conditions accumulated less than 400 RPM (reads per million) values, whereas 8 miRNAs were highly abundant as they accumulated > 10,000 RPM. Six miRNAs accumulated 400–1500 RPM, whereas 8 miRNAs had RPM counts between 1500 and 10,000. The individual RPM values of each miRNA (in all four conditions) are provided in SI Table 1. c-f Differential accumulation of miRNAs using pairwise comparisons, computed at a p-value < 0.05 and fold-change > 1.2 or < − 1.2 cut-offs. The bar-charts for each comparison plot the up- and down-regulated differentially expressed (DE) miRNAs (miRs). The red color represents up- and blue denotes down-regulation

