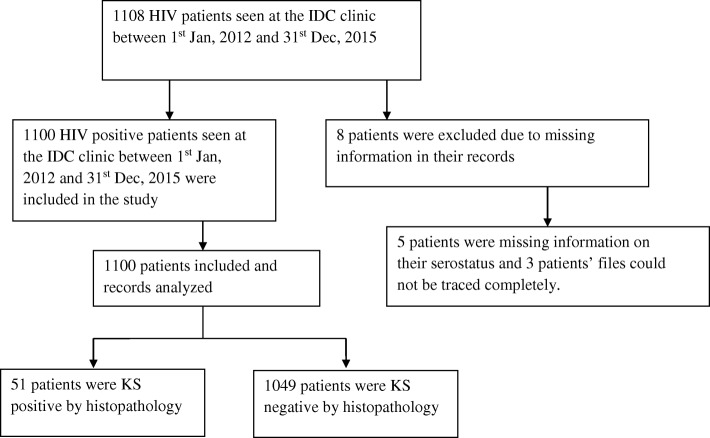
Fig. 1.
Flow diagram showing the number of patients included and excluded in the study conducted. A flow diagram showing the number of patients’ data included in this study. The diagram summarizes the patients found to be positive for KS among all the patients that tested positive for HIV during the study period

