
Fig. 3.
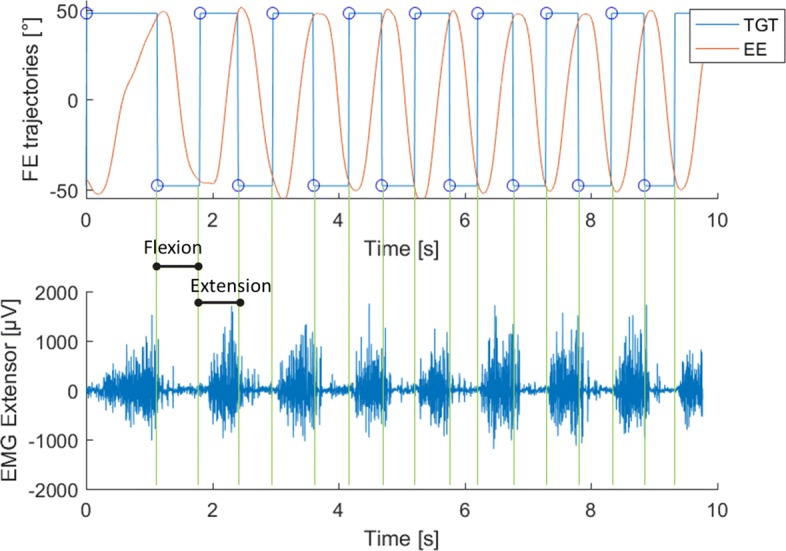
Example of data segmentation. a. Red lines represent an example of the end-effector trajectory in the flexion-extension plane to reach the target at ±48° (blue lines). b Example of sEMG signal of the extensor carpi radialis during the task. The signal was segmented according to the trajectory shown in Panel a